The chart below shows the data of the number of cars bought by Millennials and Gen $\text{X}$ people in a country from the year $2010$ to $2020$ as well as the yearly fuel consumption of the country (in Million liters).
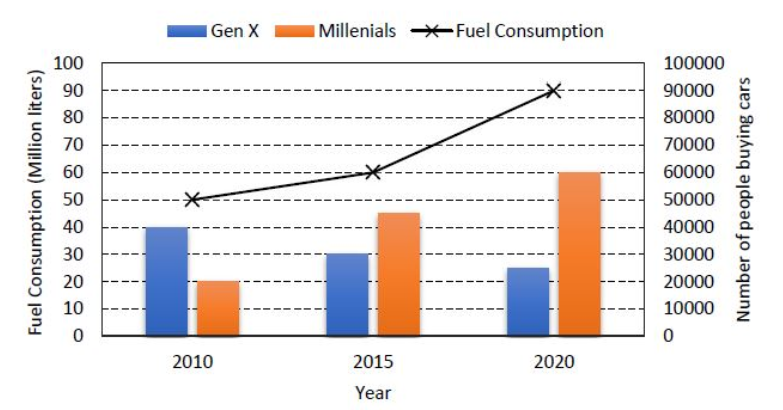
Considering the data presented in the chart, which one of the following options is true?
- The percentage increase in fuel consumption from $2010$ to $2015$ is more than the percentage increase in fuel consumption from $2015$ to $2020$.
- The increase in the number of Millennial car buyers from $2015$ to $2020$ is less than the decrease in the number of Gen $\text{X}$ car buyers from $2010$ to $2015$.
- The increase in the number of Millennial car buyers from $2010$ to $2015$ is more than the decrease in the number of Gen $\text{X}$ car buyers from $2010$ to $2015$.
- The decrease in the number of Gen $\text{X}$ car buyers from $2015$ to $2020$ is more than the increase in the number of Millennial car buyers from $2010$ to $2015$.