The magnitude Bode plot of a network is shown in the figure
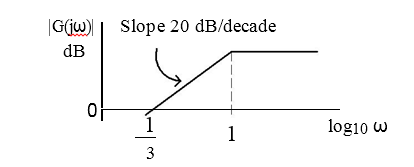
The maximum phase angle $\phi _m$ and the corresponding gain $G_m$ respectively, are
- $-30^{\circ}$ and $1.73$ $dB$
- $-30^{\circ}$ and $477$ $dB$
- $+30^{\circ}$ and $4.77$ $dB$
- $+30^{\circ}$ and $1.73$ $dB$